On Friday last week I had the pleasure of hosting a half-day Nanostring symposium at Cancer Research UK’s Cambridge Institute (my previous employer). The symposium was arranged as an opportunity to get Nanostring users, and potential users, together to hear about the exciting developments in nCounter technology as well as digital spatial profiling and the new Nanostring Hyb&Seq assay.

Introduction to Nanostring by Michael Rhodes (Senior Director Advanced Sequencing Applications at NanoString): Nanostring was founded in 2003 and sold it’s first instrument in 2008 (I first encountered Nanostring in the same year at an ABRF link meeting and have been following developments ever since). There are currently around 600 employees working on developing the core optical barcode technology into the systems we heard about at the symposium. Nanostring has a well defined mission statement “to extract maximum biology from minimal samples” (forgive me if I paraphrased Michael incorrectly) and they achieve this by squeezing out DNA, RNA and Protein information from a single sample. The talks summarise below show how Nanostring are branching out into other areas: IO360, DSP, Hyb&Seq, and will continue to develop the research tools (nCounter) and the clinic (Flex eg Prosignia). Michael gave a basic overview of the digital counting tech using optical barcodes, and Nanostring have several useful pages on their website.
IO360 talk by Professeur Karen Leroy, MD, PhD:
The first speaker came from Paris where she has been a Professor in Molecular Oncology at the Institut Cochin, Paris since 2008. She heads somatic genetics of solid tumours in Cochin Hospital and her research is focused on genomic biomarkers that can be used to improve precision medicine in solid tumours.
She presented on her groups work using the Nanostring IO360 panel, which they have been using in the CERTIM project – a prospective outpatient cancer cohort treated with checkpoint inhibitors at the Institut Chocin. This include 160 patients with NSCLC, bladder cancer or melanoma. They are aiming to Identify biomarkers that predict toxicity response as well as clinical response (see the press release for their paper describing how antibiotics affect the efficacy of immunotherapy).
The primary question was “can Nanostring’s IO360 panel identify patients who will benefit from checkpoint inhibitor therapy, or those patients who may progress rapidly or suffer toxicity issues on therapy?” She mentioned the JCI Tumour inflammation signature (TIS) paper from Merck – 18 genes – where almost all responders have T-cell inflamed tumours; quoting the paper that said “a T-cell inflamed phenotype maybe necessary but not sufficient for response to anti-PD1 therapy (pembrolizumab)”. Using the IO360 panel, which analyses gene expression from 770 genes for tumour, microenvironment and immune responses, users are able to interrogate Merck’s TIS as it is one of many signatures reported by this panel. She said how simple it is to run the Nanostring panels: extract RNA from FFPE tissue (using roche high pure FFPE RNA kit) and hybridise with the codeset, run, then analyse. So far they have run 68 patients (42 NSCLC, 8 Melanoma, 10 RCC, 5 urothelial, 3 other). When discussing the QC of their results she said only 1 sample failed, however most samples were around 100ng RNA input (250ng recommended), and the one failure had an input of just 25ng: “this is a robust assay!”
Analysis of their data, all patients combined or just the NSCLC cohort, confirmed TIS signature as the most strongly associated with outcome. Others genes/signatures that were correlated were generally a subset of the TIS panel. They did see TIS-high patients who do not respond to IO therapy, as well as TIS-low patients who do; so TIS is not a perfectly predictive biomarker. However survival analysis using the clinical outcome data confirmed that TIS-high led to longest PFS/OS. Most of their patients were treated with nivolumab (52) but 9 had pembrolizumab and their results suggest that the TIS signature analysis is predictive for both pembrolizumab and nivolumab.
She concluded that the IO360 was a very easy to use and robust assay that could be used in a routine clinical setting. TIS predicts benefit of antiPD1 therapy (unsure if anyone has looked at PD-L1 therapy). The point was made that the complexity of the immune response and of tumour biology requires a holistic approach rather than the use of a single biomarker particularly if we are trying to perform “precision ImmunOncology”. Finally when comparing PD1 staining IHC to Nanostring GX (using E1L3N antibody from Cell Signalling) they saw reasonable correlation with the TIS data and they are still trying to determine why some TIS-high patients do NOT respond. If you are interested in IO biomarkers then this recent 2018 paper is well worth reading.
Digital Spatial Profiling introduction:
Oligo-conjugated monoclonal antibodies are bound to FFPE tissue sections. A registration image is taken using standard microscopy on which the user defines their regions-of-interest (ROI). A UV laser with a variable beam of 1um to 10um is used to cleave the oligo tags from bound antibodies only in the ROI (there is no discernible “leakage” from neighbouring cells). Oligo-tags are then counted on the nCounter platform (although DSP has now been demonstrated on a MiSeq: see GenomeWeb coverage from AGBT’18). Currently users can target up to 31 protein targets. It was not clear what sort of turnaround is possible, or how large the ROI can be, and the affect of ROI size/number on processing time. The instrument costs $295,000.

The technology is currently available via an early-access program although it may well be coming to a CRO near you soon – Nanostring CEO Brad Gray discussed how several contract research labs are gearing up to offer DSP as a service. He also spoke about some of the early access data on a first quarter earnings call (see coverage on GenomeWeb). There were several ASCO abstracts presenting early-access DSP data: Yale, Genentech, and multiple from Nanostring.
Digital Spatial Profiling talk by Prof Sergio Rutella MD, PhD, FRCP:
The second speaker is Professor of Cancer Immunotherapy at the John van Geest Cancer Research Centre, Nottingham Trent University. He is a haematologist with a broad background in tumour immunology, leukaemia biology and stem cell transplantation. See his ASCO abstract describing visualisation of in-situ leukemia-immune system interactions by DSP.
His talk focused on recent work using early-access to the Nanostring Digital Spatial Profiling (DSP) technology applied to bone marrow profiling (he has as a PhD student funded by Nanostring). He began with an overview of immune ecosystem of AML, and discussion of the “Hot vs Cold” tumour concept See: Chen/Mellman: Nature 2017 541:321-30 and Minn: Trends in immunology 2015 36:725. There are around 3000 AML patients per year in the NHS, it is a clonal disorder with a heterogenous clinical presentation and a high degree of molecular complexity. Prognosis is determined from cytogenetic and molecular abnormalities. The general therapeutic strategy has not changed much over the past 30 years but IO therapies are a promising option. However he made the point that we need to better understand the immune environment – hence their interest in DSP.
The project he presented focused on two main research questions 1) Is “adaptive (compensatory) immune resistance operational in the tumour microenvironment (TME) of a subgroup of patients with IFN-gamma dominant AML?, and 2) Can immune signatures predict response of patients with AML to chemotherapy and/or stratify survival?
His PhD student has been using the Nanostring PanCancer panel on both childhood and adult disease cohorts in a collaboration with Children’s Hospital Philadelphia and a hospital in Germany. They found 4 clusters i) innate+, adaptive+, ii) innate+, adaptive-, iii) mast cells + exhausted CD8 T-cells, iv) “immune desert” and can stratify patients and predict relapse free and overall survival based on these clusters. However he wanted to understand the spatial relationship of the immune cells in the tumour microenvironment hence his interest int eh DSP technology.
Sergio presented data on 10 AML biopsies where they had analysed 24 regions of interest. They selected the cells of interest by staining with three visible targets – CD123, CD3 and DAPI to identify leukaemia cells, T-cells and nuclei. They see very low T-cell infiltration but DSP allows selection of the 2-3% T-Cells. DSP revealed highly variable expression of immune checkpoint proteins in ten patients – underscoring the need to profile deeply for personalised IO therapy. He concluded by saying that IFN-related DNA damage resistance gene programmes render cells resistance to chemo, and that immune gene/protein signatures could be integrated with existing prognostic tools as therapy-predictive markers for AML.
Both academic talks commented on how easy to use the nSolver software was.
Hyb&Seq introduction by Michael Rhodes:
Michael started with a question: “Why make another sequencer?” and made the case that there needs to be a simpler workflow which has minimal hands-on and requires no specialised equipment for “library” prep, but delivers rapid sample to answer for DNA & RNA, on clinically relevant samples. He pointed out that Illumina’s quick reference cards for rapid exome library prep alone are 18 pages long! Lastly he underscored Nanostrings view that any system MUST work with FFPE tissue, which has been the baseline for all their Hyb&Sseq development.
Hyb&Seq is a radically different use of Nanostring’s core optical barcode technology. It delivers single-molecule DNA&RNA sequencing with no amplification, no enzymes; just hybridisation and imaging.
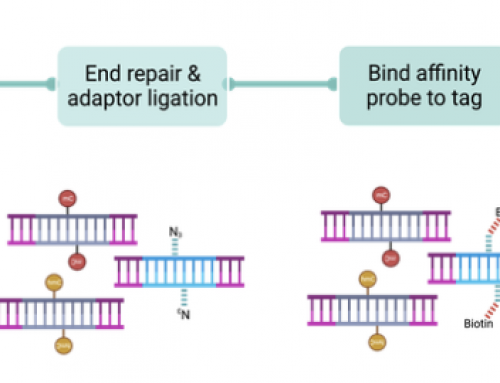
Hybridisation sequencing works by binding nucleic acids to the Nanostring slide surface (see below for the H&S workflow from my AGBT’17 write up on this blog). Sequencing probes are randomly hybridised along a 50-100bp window but the technology can sequence across much larger regions. Sequencing probes are hexamers ( and use new barcode tags) – 4096 probes are designed to all 6mers and bind rapidly through standard hybridisation chemistry, then specific reporter regions are read with secondary probes. Three rounds of reporter probe hybridisation determine which hexamer is bound and et voila sequencing! 2.5-22 hours sequencing run lengths are dependant on on read length.

6mers probes fall randomly into a sequencing window building up sequence coverage with each round of hybridisation, generating a 1st pass error rate of around 1-2%. RNA & DNA molecules are captured at the same time after lysing cells – Michael showed nice false colour image showing discrimination of RNA DNA spots, as well as long-read sequencing (see below – sorry for the low quality image) where they can use blocking oligos to restrict sequencing to specific regions.

The collaboration with LAM research to develop Hyb&Seq is now focused on ordered arrays to very significantly increase density of single molecules on the surface of the slide. Using capture oligo deposited as spots to select a single molecule per spot nanostring can make flowcells with 20 million or 80 million features.
Michael finished up by highlighting another early-access customers data. Chris Masons lab have been testing H&S for pathogen identification. They have developed a cross-kingdom, universal-samples (blood, poo, etc) DNA&RNA, easy, fast, cheap, accurate and precise assay using the Hyb&Seq single tube assay for fast sequencing sample-to-answer. The assay has a limit of detection as low as 10 microorganisms per sample in just 1000 cells. And does not suffer from interference from the dominant Human DNA in a sample due to careful probe design. High-concordance of this Hyb&Seq assay was shown with standard tests when run on clinical samples from Weil Cornell Institute, for a 4 hours sample-to-result for pathogen identification from as few as 1000 bacterial cells.
Hyb&Seq talk by Dr Anna Piskorz (CRUK-CI):
Anna is a post-doc in James Brenton’s lab at CRUK-CI. The lab works on Ovarian Cancer and has been a big user of my old Genomics Core facility. Anna was presenting the early-access collaboration between CRUK and Nanostring, where she has been aiming to design a panel to generate mutation, CNV and GX data from FFPE clinical samples. OvCa is more than one disease (Vaughan et al Nature 2011) and 99% of HGSOC patients have TP53 mutations as well as many CNV changes (take a look at their 2017 BioRxiv paper on sWGS).
The data was first presented at AGBT’18 (take a look at GenomeWebs pretty comprehensive coverage).
Their proof-of-concept assay targets mutations in TP53, 3 CNV amplified genes (CCNE1 MYC TP53) and 6gene expression targets. Probes are designed so they do not interfere: mutation detection on antisense strand, CNV against antisense but designed to in introns, and gene expression on sense and across exon:exon boundaries. The assay requires just 35 minutes hands on time with no library prep and no amplification from FFPE tissue. It generates the SNV, CNV & GX data in under 24 hours.
They compared Hyb&Seq results against MiSeq (TAm-Seq) and showed high concordance for TP53 mutations using mixes and reference DNA samples. 40 Hyb&Seq sequencing cycles generate plenty of coverage for high accuracy mutation detection – error rate were well under 1%. The CNV assay was tested using DNA from leukaemia cell line and generated very good results. One issue is that the Ovarian Cancer genome is very rearranged making it hard to select invariant controls for assay; but CNV correlation of nCounter with Hyb&Seq was very high.
Al in all the half-day symposium was well worth attending and it is clear Nanostring have a lot of very useful technology available, and some very exciting tools in development.
Thanks to the speakers, to Nanostring and to Anna for help in organising this one.


Leave A Comment